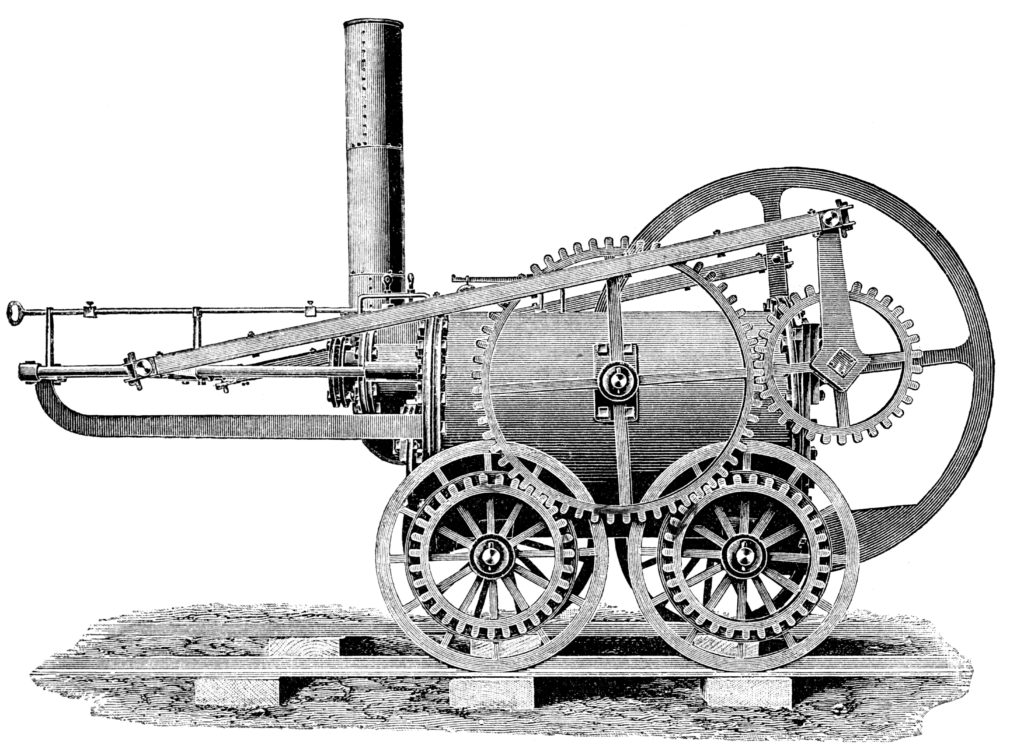
In 1808, Richard Trevithick demonstrated his pioneering steam locomotive on a circle of track in Bloomsbury, London. It is thought that the high loads from the serrated wheels he used with the aim of improving adhesion, caused rail breaks, leading to derailments. For more than 200 years railway engineers have had to deal with rail breaks and poor adhesion. Over that time great strides have been made in understanding the issues at the wheel rail interface.
The current organisations leading this work are the RSSB-sponsored Vehicle/Track System Interface Committee chaired by Gareth Evans, Network Rail Technical Head of Track, and its sub-group the Adhesion Research Group chaired by Neil Ovenden Head of Engineering, Rail Delivery Group.
Each year they present updates to the industry at an event organised and hosted by RSSB. On this occasion a face-to-face event was held in the York National Railway Museum with an on-line feed.
This article covers track-train interaction. Adhesion will be covered later in this issue.
Rail management
A fixture at the event is Brian Whitney, Network Rail’s expert for track and S&C. He appears to have infinite capacity to frighten the audience with his images of broken or damaged track, while reassuring them with the learning that gets fed back to asset management teams.
There is approximately 30,000km of track (60,000km of rail) in the UK and currently there are circa 80 to 90 breaks per year, down from approximately 10 times that number before the year 2000. It was the Hatfield train crash in 2000 that shone a very bright light on rail breaks and the attention paid to this subject since then has been instrumental in delivering the improvement although Brian cautioned that the number has been in the 80-100 range for the last five years, with no sign of further improvement. The top two causes, representing over 25% of all breaks, were rail foot corrosion and breaks in tri-metallic welds – used where a stainless steel insert is used in the weld between rail and cast crossings.
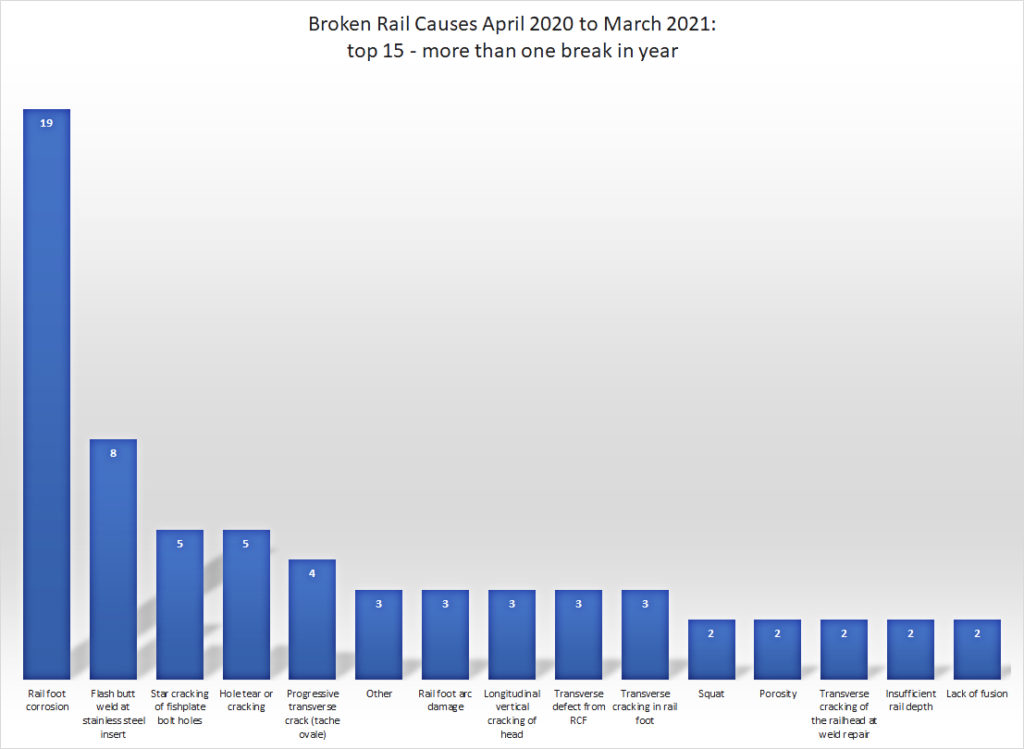
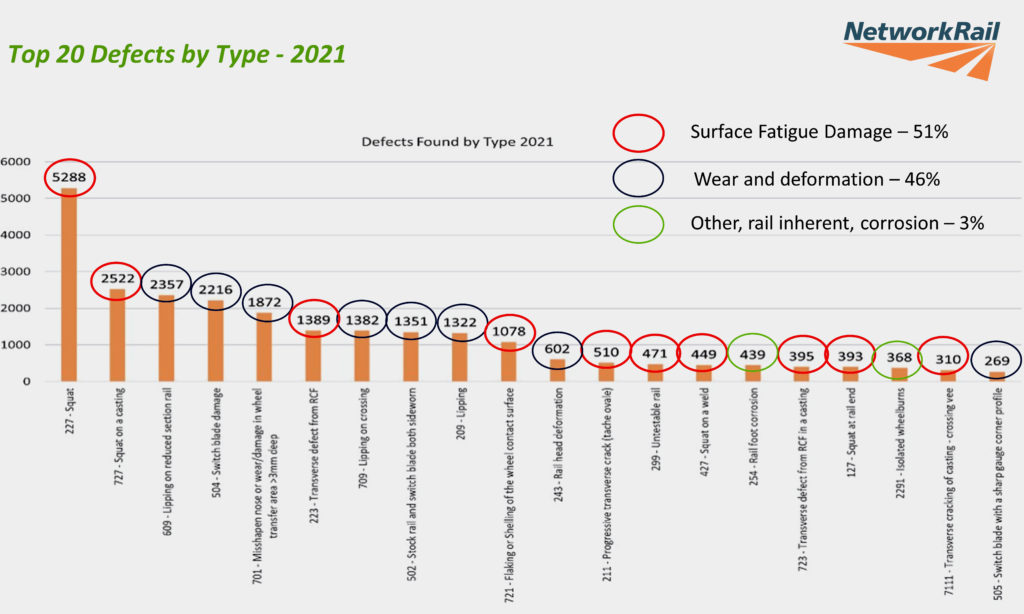
Part of the improvement stems from the attention paid to managing rolling contact fatigue and the grinding programme that restores a crack free rail head. However, there is also rigorous management process of testing, monitoring, and action to eliminate defects before they become fractures.
There are some 30,000 rail defects reported per year, over half of which are caused by surface defects arising from the fingernail sized contact between wheel and rail. All must be dealt with in accordance with timescales prescribed in standards, sometimes accompanied by a speed limit.
Detecting defects
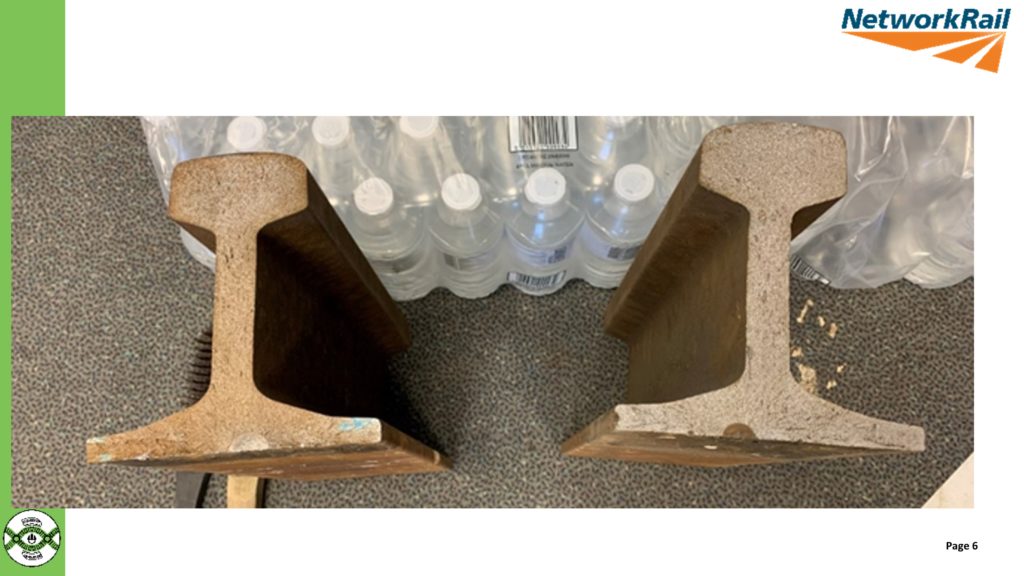
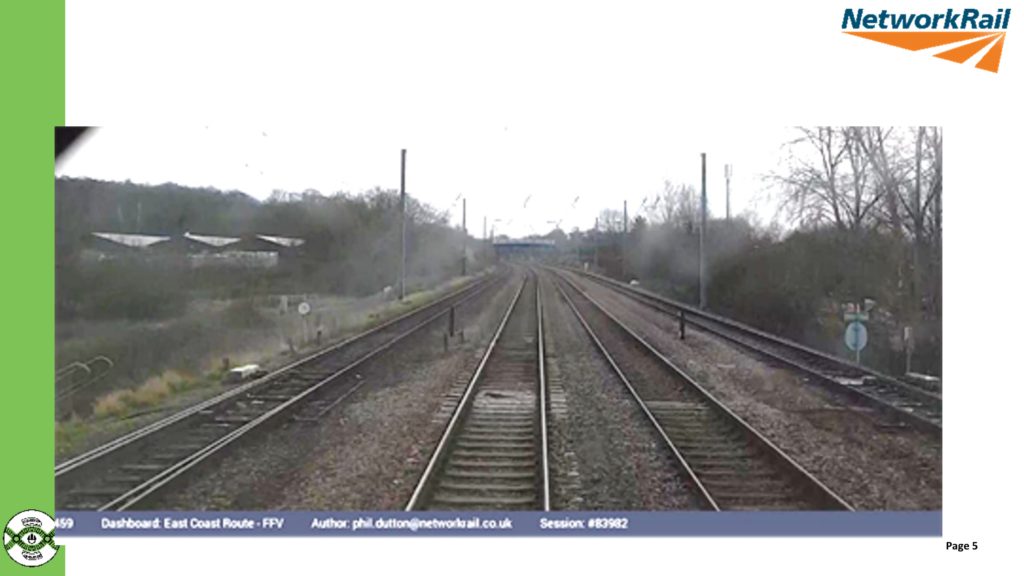
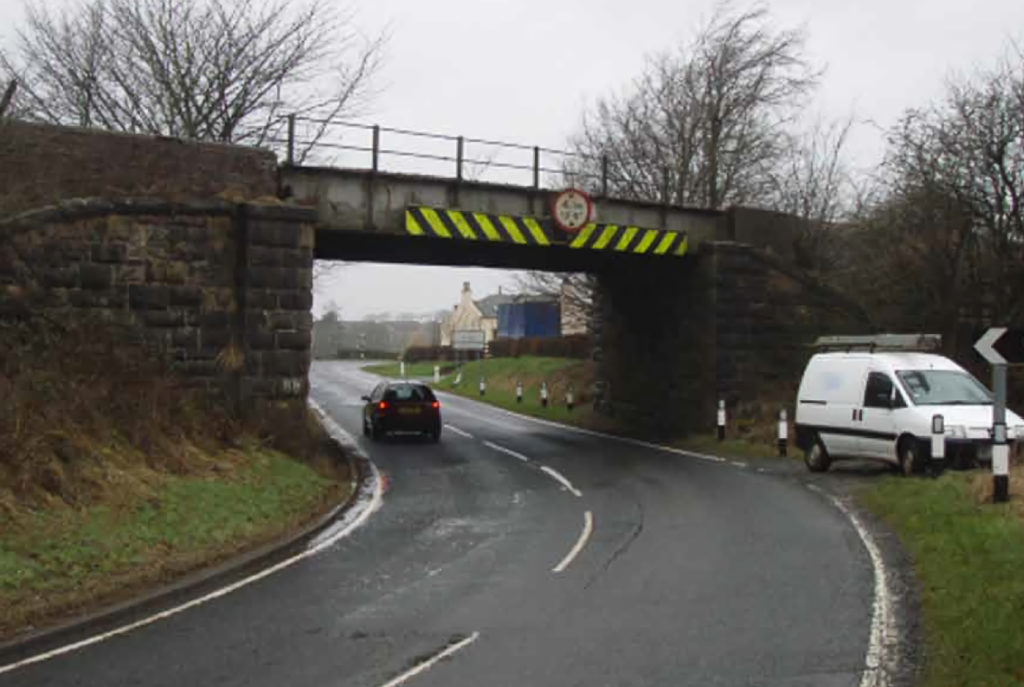
Dealing with rail defects costs more than £150 million per year, and part of Brian’s remit is to find ways of detecting defects so they can be dealt with during routine maintenance rather than having any form of emergency work carried out. He illustrated this with an incident where both rails broke almost next to each other at Sandy North.
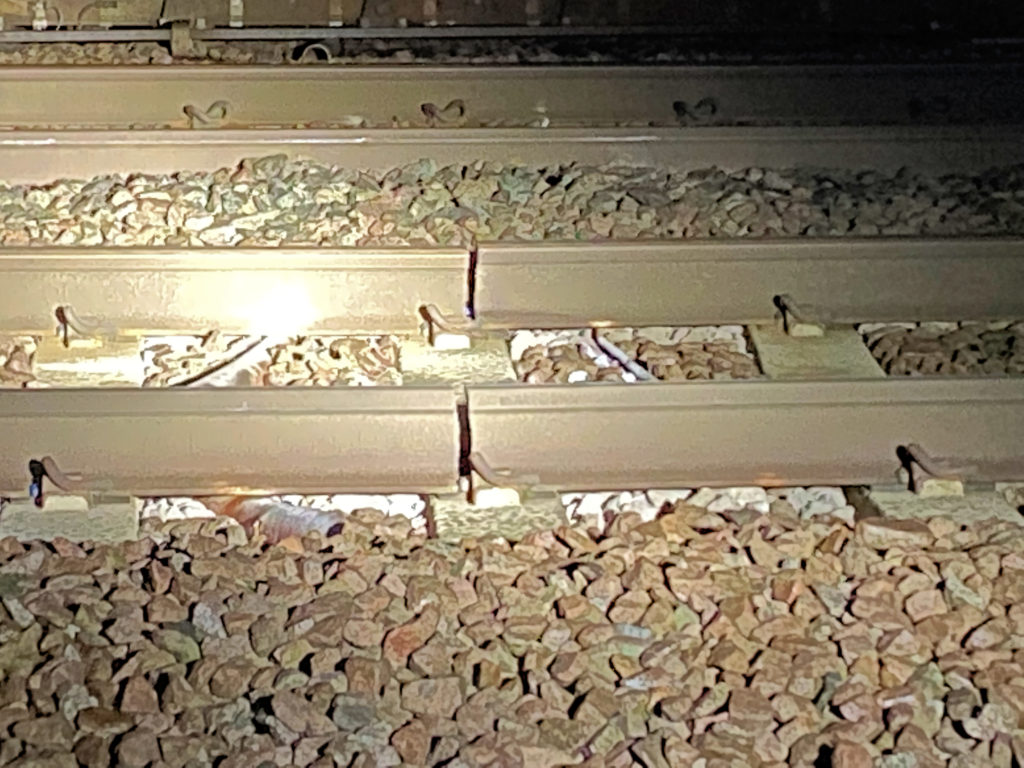
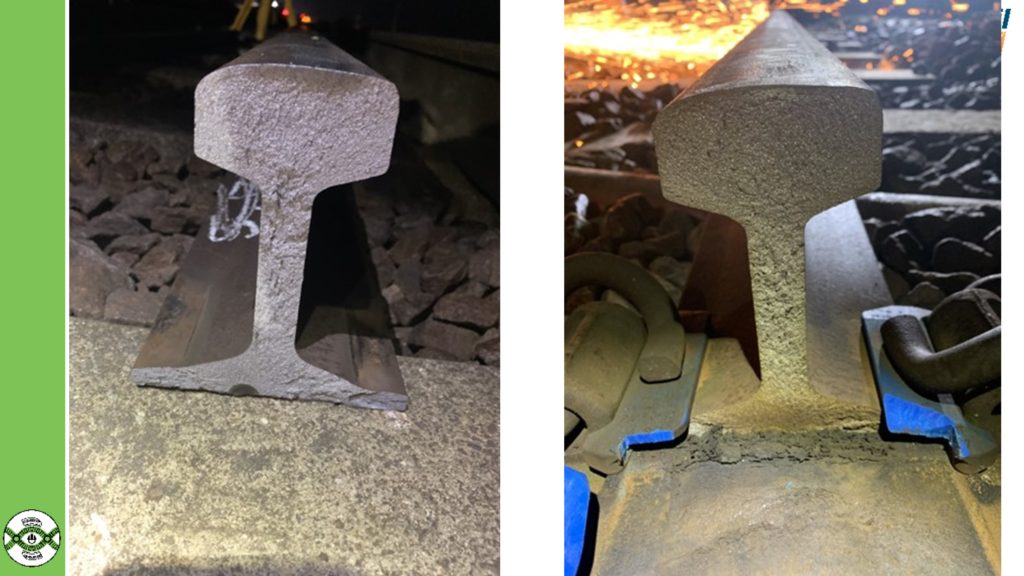
The track had been laid in 1988 vintage CEN 56 section rail, supported on F27 concrete sleepers. Both had broken from small foot cracks which, under tension from a slight dip angle of 10 to 15 milliradians had fatigued and then fractured. It was discovered that one rail had fractured some time before the other and the fault was only detected when the second rail fractured, which interrupted the signalling. Brian added that this area had discoloured ballast partly because of paint markings highlighting cables routed under the ballast, and partly from the localised attrition under increased dynamic loads, indicating that this small area had not been tamped.
In discussion, Brian agreed that a way of managing defect precursors might be for areas, not able to be tamped or otherwise having discoloured ballast or slight dips, to be given expert attention from track maintainers, perhaps using stone blowing.
Brian also reflected that although rail foot corrosion/cracks represent just under 1.5% of the defects, it is also the cause of more than 25% of all the rail breaks. He said that rail foot cracks are the hardest to detect and had been looking at whether the conditions for rail foot fractures could be forecast.
Using data
On the theme of recognising defect precursors, Brian reported that, as an organisation, Network Rail is data rich but information poor, and he spends a great deal of time exploring how better to understand the local condition(s) of the track asset. He seeks to use data from different sources to focus on potential risk sites which will require improved information systems and accurate alignment of different data sets to enable easy correlation.
Brian wants to find ways of turning this data into algorithms that can do the same job automatically, in order to understand areas at higher risk of failure. For example, this could lead to better management of support conditions particularly at transitions/wet beds/voiding. This might, he said, lead to enhanced minimum actions for locations identified as higher risk where rail replacement may be required before a failure occurs.
Network Rail needs to consider the potential of replacing rail in at-risk locations before a physical defect is detected through routine inspection but where the fatigue life of the rail foot is shortened due to local conditions.
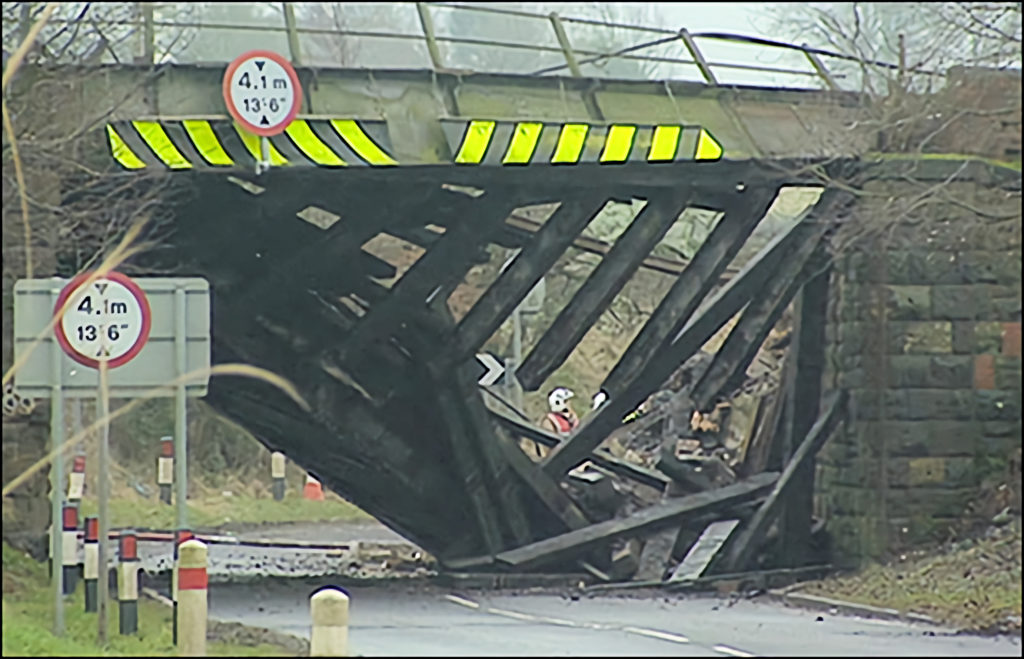
Despite the gloom, Brian was pleased with the progress that has been made in the overall culture of the industry, recognising that track does not look after itself. “Neglect it at your peril”, he said, “track very rarely fails safe.”
Track modelling
The cost of managing and rectifying track defects is one of the factors included in the rail industry’s Vehicle Track Interaction Strategic Model (VTISM) which is used by asset managers and others to understand things such as likely track degradation rates, impact of different types of rolling stock and likely budget requirements. Andy Rhodes from Serco Rail Technical Services described further enhancements to the model both to keep it compatible with computer hardware/software and to include updated knowledge and cost values.
Infrastructure
VTISM allows track engineers to investigate the impact of heavy vehicles on the track and infrastructure engineers aspire to have a similar tool focussed on the assets under the track. Professor William Powrie of the University of Southampton introduced Modelling the Impact of Heavy Axle Weight (HAW) on Infrastructure. HAW vehicles (defined here as an axle weight of 22.8 to 25.4 tonnes) can cause disproportionate damage to the infrastructure.
This project has scoped a methodology for developing, populating, and validating a model to understand and quantify the incremental effects of HAW on rail infrastructure. This, together with possible mitigations and associated costs, would enable an estimate of the impact of HAW. Infrastructure covered: geotechnics (earthworks, embankments, and cuttings); bridges, substructure (natural soil, subgrade, and sub-ballast); and limiting track system features (e.g.) longitudinal timbers and directly fastened track).
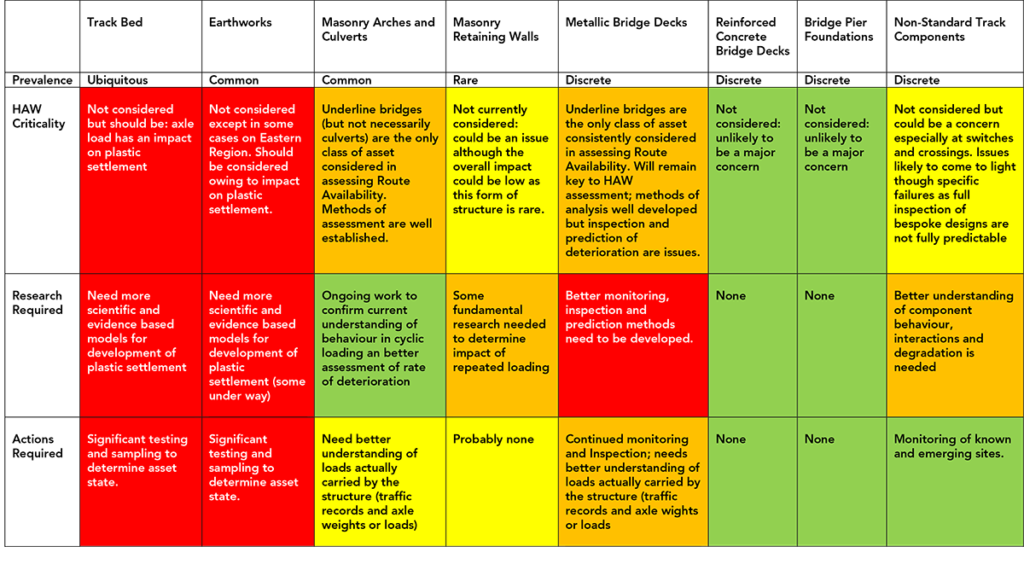
The primary impact considered was asset degradation rate. Secondary impacts were cost implications to mitigate estimated degradation and safety/reliability risks associated with different options.
William illustrated the work with a description of the behaviour of masonry arch bridges, where the rule of thumb that the working load of 50% of the collapse load has been confirmed by testing, although there is always some uncertainty around the original construction and current condition.
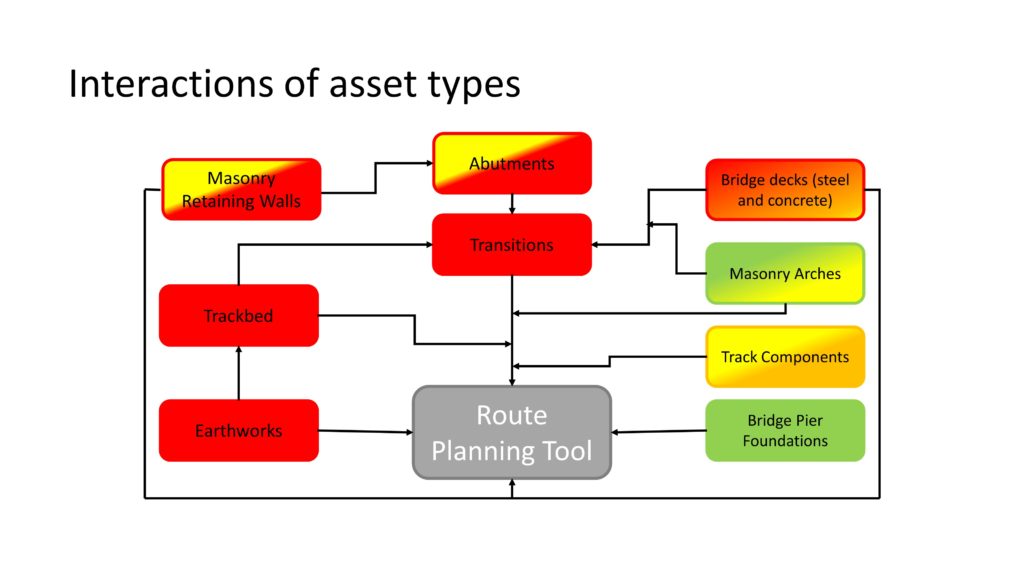
The project has collated the current understanding of the condition of various asset types in a hazard assessment and identified work required to populate the proposed model. It has also shown how the various asset types interact.
In both cases, considerable additional understanding and/or knowledge is required to fully populate the proposed model.
Lateral loading – best practice
Adam Bevan, Professor of Railway Systems Engineering at University of Huddersfield reported on a project to review lateral track loading requirements, as the current practice for specifying loading for track design is inconsistent. He said that although loading standards are typically based on known satisfactory performance of existing track systems, there are variations in how these loads are interpreted and whether they are being over or under specified.
Adam outlined a whole range of current standards where the limiting lateral forces are significantly different with the largest force specified being twice the smallest in some cases. A large number of dynamic simulations have been undertaken to quantify the multitude of lateral loads for a wide range of vehicle types and operating conditions.
Outputs have, not unexpectedly, shown the key influence parameters such as axle load, curve radius, and cant deficiency, but have also shown that typically the lateral force is not an average across the two axles of a bogie; generally there is a higher force from one of the axles. The next stage is to develop a framework for lateral loading.
When is a wheel flange too thick?
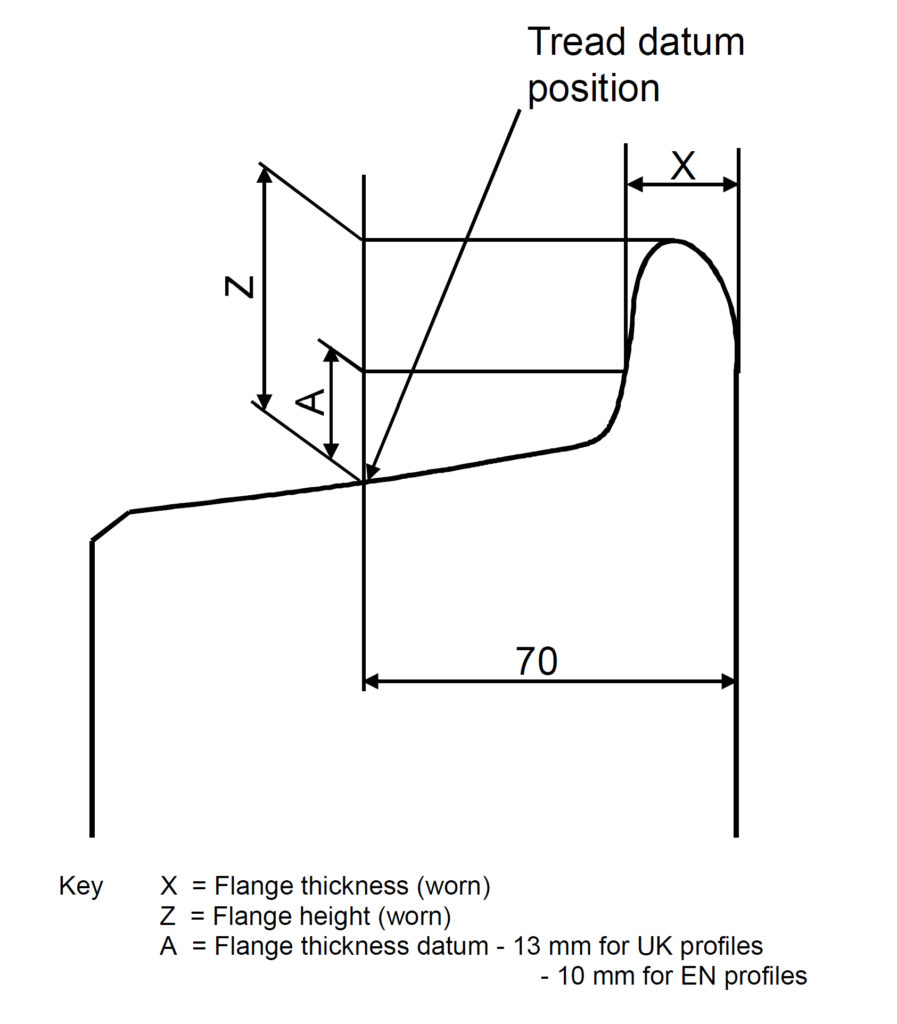
Julian Stow and Jordan Brant, both from University of Huddersfield, reported on their work ‘Investigating the need for a maximum flange width limit’. Group Standard GMRT2466 sets out the requirements for the control of geometry of wheels including maximum new and worn flange width (at a specified height above the wheel tread) and maximum new and worn flange height. There is currently no limit on the maximum worn flange width, although flange width can increase where tread wear dominates, something increasingly common on modern passenger vehicles with good steering characteristics. There is a requirement in the Rolling Stock National Technical Specification Notice for flange width not to exceed 33mm but measured at a height of 10mm, not the UK practice of 13mm (dimension A in the diagram).
The work included a survey of different wheel profiles to assess the scale of the issue, followed by an assessment of the potential hazards using various simulation and modelling methods. These highlighted that the key reason for specifying a maximum flange width was to ensure that good guidance and protection is maintained at crossing noses. The study has recommended limits which will be considered by RSSB for future inclusion in the standard.
This was a lively event and even the online audience could tell that people were pleased once again to be able to meet face-to-face.
Thanks to the presenters for their assistance in producing this article and to Ben Altman from RSSB. Illustrations courtesy of the presenters.
